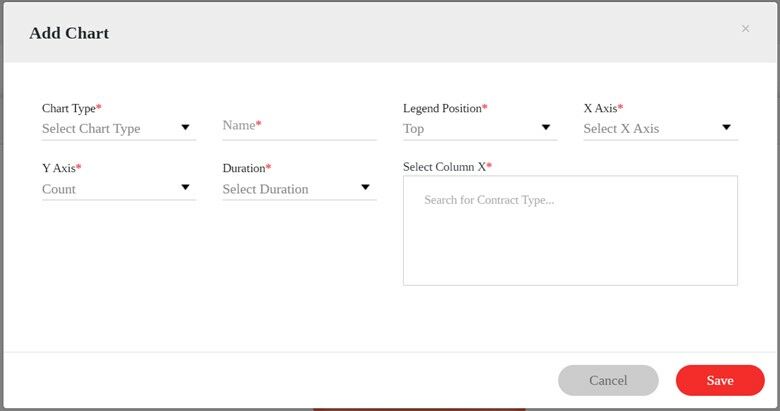
To create a chart, navigate to Reports > Chart tab and click the Add button. A pop up will appear.
Set the parameters for the chart that you will be making, name it and click Save.
To edit a chart:
a. Navigate to Reports > Chart
b. Locate the chart that you want to edit
c. Click the pencil icon
d. Set your changes
e. Click Save
To delete a chart
a. Navigate to Reports > Chart
b. Locate the chart that you want to edit
c. Click the trash icon
d. Click Yes
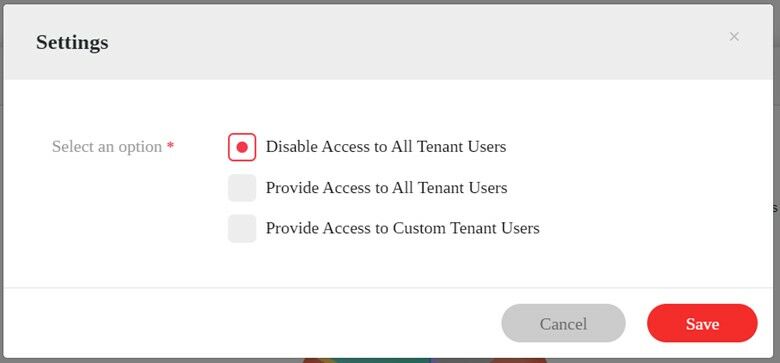
To give or disable access to a chart:
a. Navigate to Reports > Chart
b. Locate the chart and click the gear icon.
c. Select from one of the following:
d. Click Save


